Defining Characteristics of Diabetic Patients by Using Data Mining Tools
U. Tugba Simsek Gursoy
DOI10.4172/2471-9781.100015
U. Tugba Simsek Gursoy*
Faculty of Business Administration, Department of Quantitative Methods,Istanbul University, Turkey
- *Corresponding Author:
- Gursoy UTS
Faculty of Business Administration
Department of Quantitative Methods
Istanbul University, Turkey
Tel: +90 212 440 00 00
E-mail: tugbasim@istanbul.edu.tr
Received date: November 25, 2016; Accepted date: November 29, 2016; Published date: November 30, 2016
Citation: Gursoy UTS. Defining Characteristics of Diabetic Patients by Using Data Mining Tools. J Hosp Med Manage. 2016, 2:2.
Abstract
Most organizations have large databases that contain wealth of potentially accessible information. Data mining techniques can be used to discover hidden patterns that are unknown a priori. Data mining is the process of selection, exploration and modelling of large quantities of data. Data mining has worthy applications in finance, communication, education, marketing and health management. In this study health management is chosen as an application area. It is very important to encountered similarities of past period cases and definition of patient profile in the health services quickly and to decide correctly. It is aimed to define specific characteristics of diabetic patients in Turkey by using Cluster Analysis and Association Rules
Keywords
Diabetic patients; Association rules; Cluster analysis; Data mining
Introduction
Among chronic diseases, diabetes is increasingly becoming a threat to all age groups on a global scale. Diabetes mellitus prevention and control studies are being conducted commonly. As well as making lifestyle changes, people with diabetes often need additional treatments such as medication like insulin to control their diabetes, blood pressure and blood fats. Diabetes, often referred as diabetes mellitus, describes a group of metabolic diseases in which the person has high blood glucose (blood sugar), either because insulin production is inadequate, or because the body's cells do not respond properly to insulin, or both. Patients with high blood sugar will typically experience polyuria (frequent urination), they will become increasingly thirsty (polydipsia) and hungry (polyphagia).
Worldwide, it afflicts more than 422 million people. And the World Health Organization estimates that by 2030, that number of people living with diabetes will more than double [1].
In this paper the data set of a hospital which is operated in Turkey is used. The profile of the diabetic patients are tried to be identified.
Application
There are 21 variables and 148 records in the dataset. Some of the variables are “Age, Gender, Height, Weight, Hypertension, etc.” Cluster Analysis is used to identify the profile of the patients.
Association Rules are used to find which illness occured together. IBM Modeler is chosen to apply analysis.
The variables are examined in detail.
Age
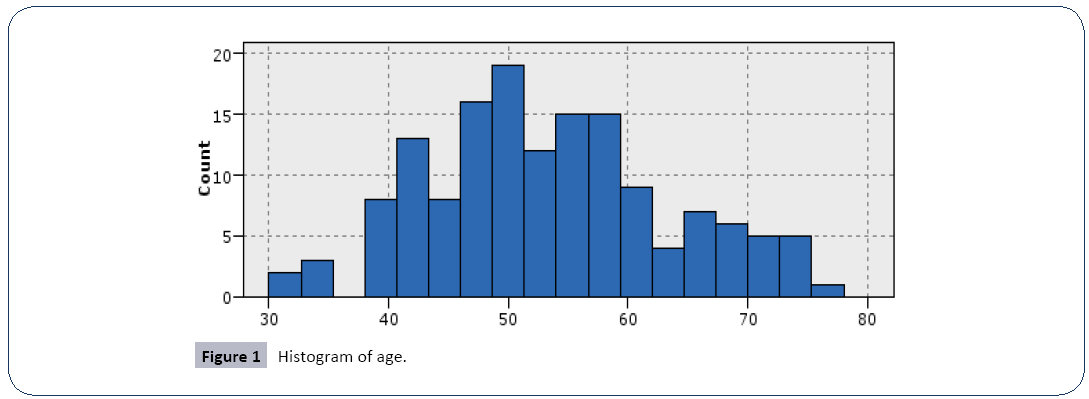
The patients are between 30 and 78. The mean of the age is 53,257 and diabetes is more common in patients over 40 years (Figure 1).
Gender
77.03% of the patients are women and 22.97% are men. Diabetes affects women more.
Height
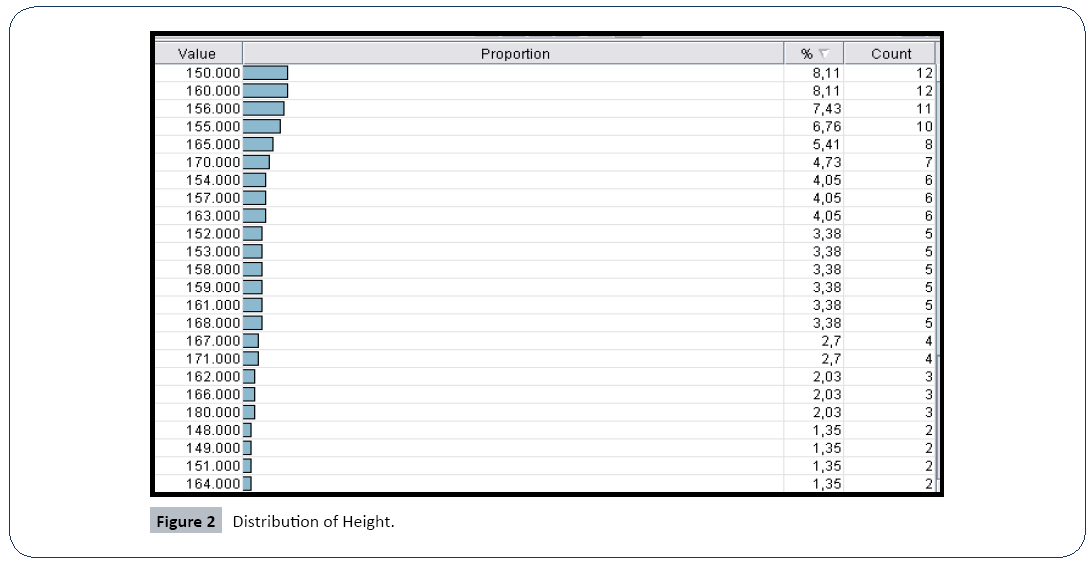
Short people are at risk for diabetes. Patients who are under 170 cm in height are more likely to be affected by the risk of diabetes (Figure 2).
Weight
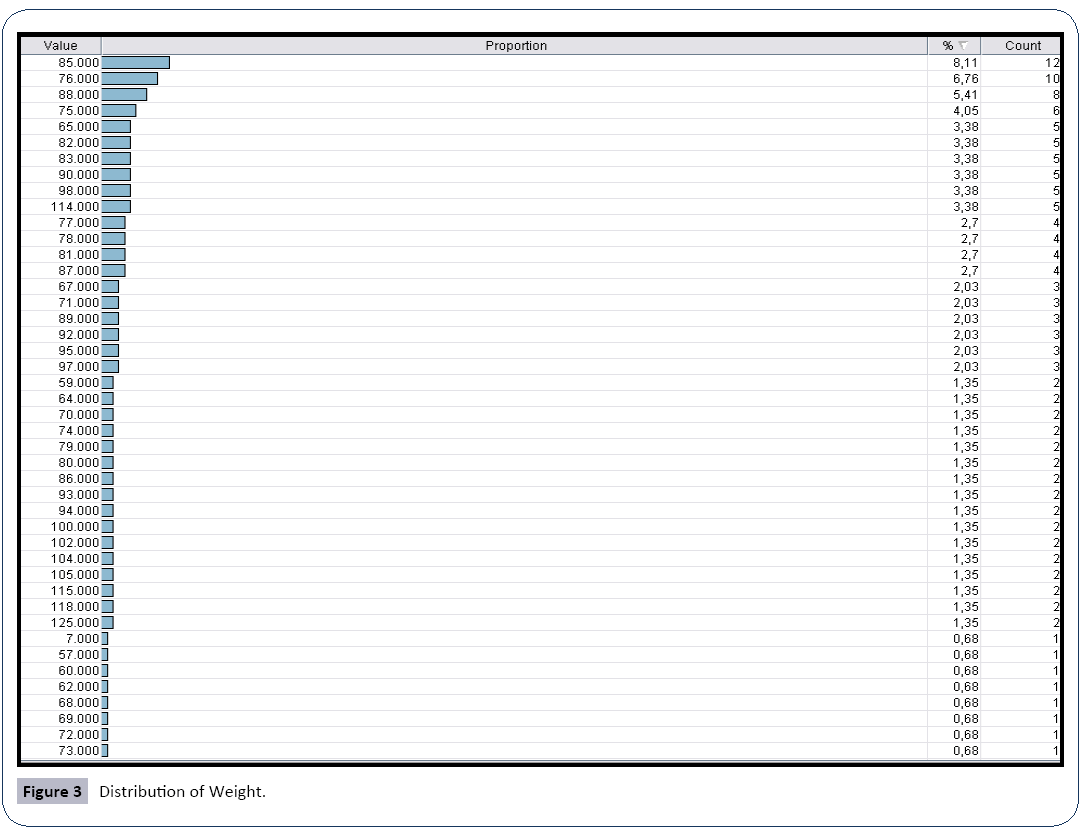
Overweight people have a higher risk of diabetes. People weighing at least 65 kg are more likely to suffer from diabetes (Figure 3).
Body Mass Index (BMI)
The body mass index (BMI) is a value derived from the mass (weight) and height of an individual. The BMI is defined as the body mass divided by the square of the body height. Commonly accepted BMI ranges are underweight: under 18.5 kg/m2, normal weight: 18.5 to 25, overweight: 25 to 30, obese: over 30.According to the results, those in the risk group and those in the diabetes are in the “Overweight obese 1, Obese 2 and Morbid obese classes” (Figure 4).
Hypertension
One of the indicators of diabetes is hypertension. 63.51% of the people in the data set have hypertension, and 36.49% do not have high blood pressure. These ratios show that almost two thirds of diabetic patients are also suffering from hypertension.
Hyperlipidemia
One of the indicators of diabetes is hyperlipidemia. 59.46% of the patients have this disease, while 40.54% do not have this disease.
Hyperlipidemia is abnormally elevated levels of any or all lipids and/or lipoproteins in the blood. Hyperlipidemia or dyslipidemia is also called high blood cholesterol.
Menopause
Menopause is a condition seen in women. For this reason, male patients are ignored. According to the results, diabetes is likely to occur in women entering the menopause process.
Duration of diabetes
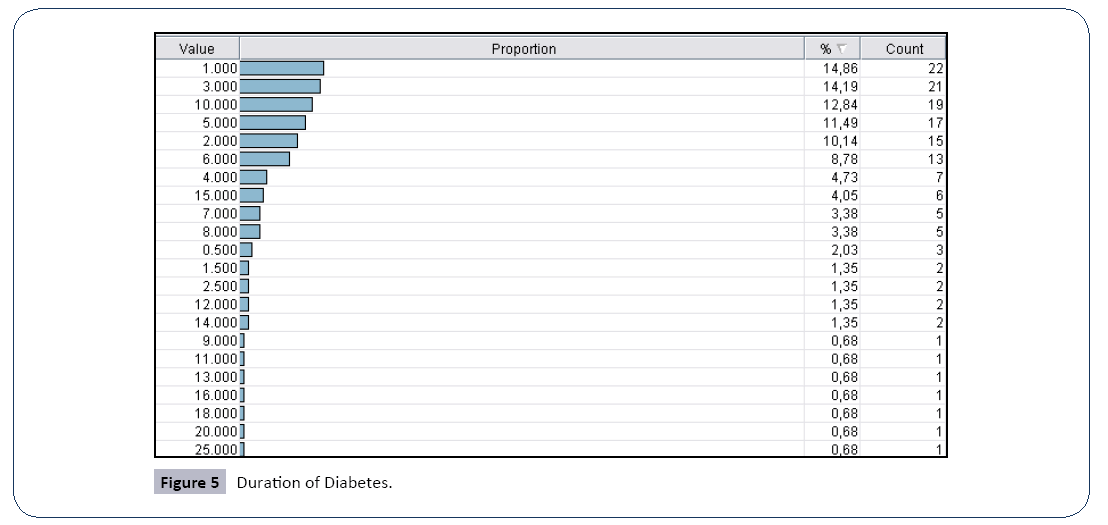
Diabetes has no cure but by constantly controlling, diabetic patients can live as normal- healthy people. In Figure 5 distribution of “duration of diabetes” can be seen (Figure 5).
Insulin resistance
Insulin is a hormone made by the pancreas. It allows the cells to use glucose (sugar) for energy. People with insulin resistance have cells that don’t use insulin effectively. This means the cells have trouble absorbing glucose, which causes a buildup of sugar in the blood. If the blood glucose levels are higher than normal, but not high enough to be considered type 2 diabetes, you have a condition called prediabetes.It’s not entirely clear why some people develop insulin resistance and others don’t. Being overweight or obese are the leading risk factors. A sedentary lifestyle can also cause prediabetes or type 2 diabetes, especially if you’re also overweight.Insulin resistance is seen in 76.35% of patients who participated in this study.
Dual Insulin therapy
One of the most common treatments for diabetes is dual insulin therapy. 88.51% of the patients see this treatment.
Intense Insulin therapy
One of the insulin treatments is intensive insulin therapy. This treatment is very similar to human insulin secretion. Patients who took this treatment generate 88.49% of the data set.
Metformin
Metformin is the active ingredient of diabetes medicines and is especially used for Type 2 diabetes patients. 81.08% of those participating in the study consume tablets containing this active ingredient.
Hemoglobin A1c
The hemoglobin A1c test tells the average level of blood sugar over the past 2 to 3 months. It's also called HbA1c. People who have diabetes need this test regularly to see if their levels are staying within range. It can tell if you need to adjust your diabetes medicines. The A1c test is also used to diagnose diabetes. If your glucose levels have been high over recent weeks, your hemoglobin A1c test will be higher. According to the data, this value is over 5 units in patients (Figure 6).
Urea
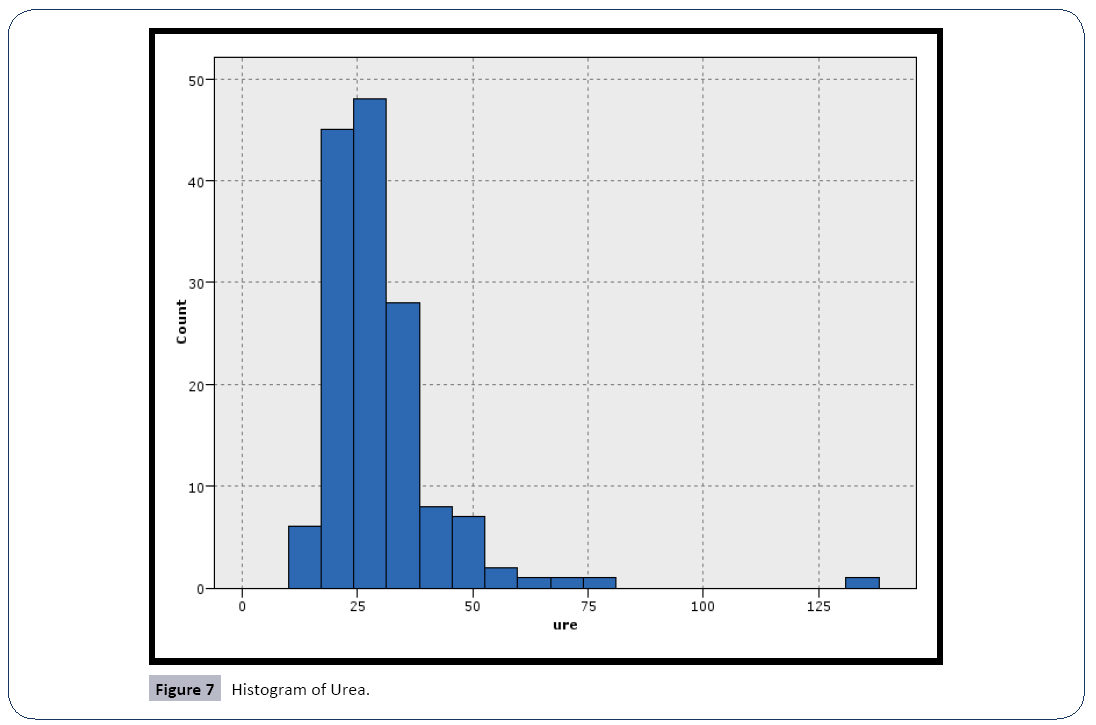
This value should be 5 to 25 mg / dl for a healthy people. It is above the value of 25 mg / dl in participants in the dataset. When this value is exceeded, Type 2 diabetes can lead to kidney failure (Figure 7).
Creatinine
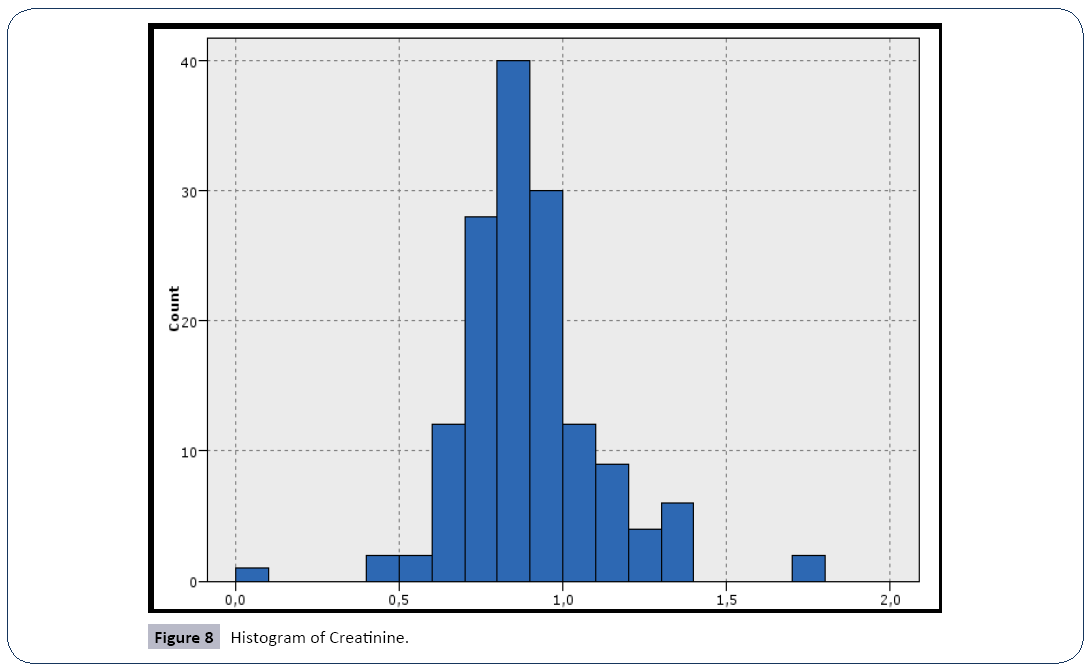
Creatinine blood test is a biochemical test used to evaluate renal function. In healthy individuals, the creatinine value should be between 0.5 and 1.30 mg / dl. Participants in the study are seen around 1 mg / dL intensively (Figure 8).
Total cholesterol
Total Cholesterol values are close to the upper limit in the vast majority of participants in the study. The value is above 200 mg / dl. in a significant number of patients
HDL cholesterol
It is desirable to be at least 40, for healthy individuals. The distribution of patients is concentrated around this value.
LDL cholesterol
A low value is desirable. The normal value of this measure is between 60-130 mg / dL. A value of 130 or higher is considered abnormal. The variance of the distribution is high in the dataset.
VLDL cholesterol
Very-low-density lipoprotein (VLDL) cholesterol is produced in the liver and released into the bloodstream to supply body tissues with a type of fat (triglycerides). For healthy individuals this value should be between 10-40 mg / dl. There are patients who are quite above the level.
Coronary artery disease
Coronary artery disease (CAD) is the most common type of heart disease. Risk factors include: high blood pressure, smoking, diabetes, lack of exercise, obesity, high blood cholesterol, poor diet, and excessive alcohol, among others. In the dataset 8 people have this disease with a rate of 5.41%.
Cluster Analysis
Cluster analysis is the well-known descriptive data mining method. The objective of cluster analysis is to cluster the observations into groups that are internally homogeneous and heterogeneous from group to group. Choosing the right number of clusters is fundamentally important [2].
K-means method is used for the Cluster analysis. K-means [3] is one of the simplest unsupervised learning algorithms that solve the well known clustering problem. The procedure follows a simple and easy way to classify a given data set through a certain number of clusters (assume k clusters) fixed a priori. The main idea is to define k centroids, one for each cluster. These centroids shoud be placed in a cunning way because of different location causes different result. So, the better choice is to place them as much as possible far away from each other. The next step is to take each point belonging to a given data set and associate it to the nearest centroid. When no point is pending, the first step is completed and an early groupage is done. At this point we need to re-calculate k new centroids as barycenters of the clusters resulting from the previous step. After we have these k new centroids, a new binding has to be done between the same data set points and the nearest new centroid. A loop has been generated. As a result of this loop we may notice that the k centroids change their location step by step until no more changes are done. In other words centroids do not move any more.
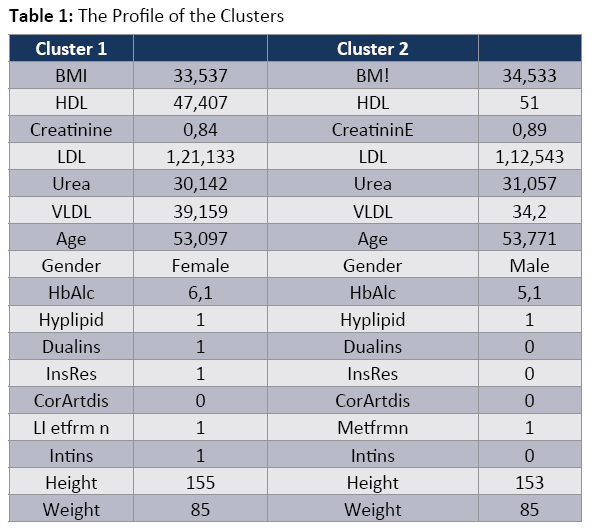
The most appropriate cluster number is 2 for the dataset. Cluster profiles can be seen in Table 1.
Association Rules
Association rules are derived from a type of analysis that extracts information from coincidence. This methodology allows to discover correlations, or co-occurences of transactional events. Association rules analysis will be most useful when doing exploratory analyses, looking for interesting relationships that might exist within a dataset [4]. The classic application of association rule mining is the market basket data analysis, which aims to discover how items purchased by customers in a supermarket or a store are associated. Besides market basket data, association analysis is also applicable to other application domains such as bioinformatics, medical diagnosis, web mining, education, finance and scientific data analysis [5]. In this paper a medical application of association rules are used.
Rule support and confidence are two measures of rule interestingness. They respectively reflect the usefulness and certainty of discovered rules. Typically, associated rules are considered interesting if they satisfy both a minimum support threshold and a minimum confidence threshold. Such thresholds can be set by users or domain experts. Additional analysis can be performed to uncover interesting statistical correlations between associated items [2].
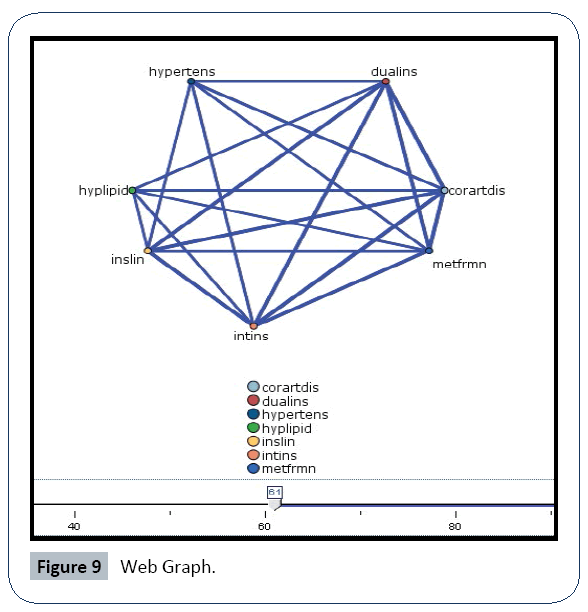
Web graph shows which symptoms occur together. For example, patients who have hypertension, also have coroner art disease and use metformin (Figure 9).
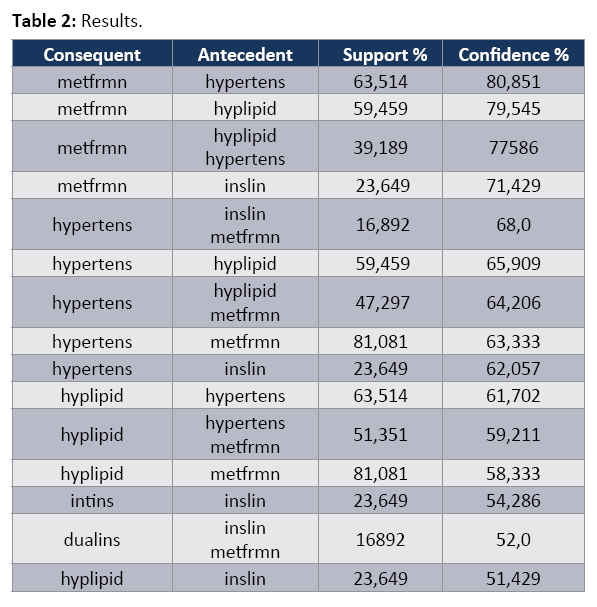
Rulesets can be seen in Table 2.
• 80.851% of the patients who have hypertension, also use metformin. The support rate is 63.514%.
• 79.545% of the patients who have hyperlipidemia, also use metformin. The support rate is 59.459%.
• 68% of the patients who have insulin resistance and use metformin, also have hypertension. The support rate is 16.892%.
• 65.909% of the patients who have hyperlipidemia, also have hypertension. The support rate is 59.459%.
Conclusion
Diabetes is a chronic, metabolic disease characterized by elevated levels of blood glucose, which leads over time to serious damage to the heart, blood vessels, eyes, kidneys, and nerves. For people living with diabetes, access to affordable treatment, including insulin, is critical to their survival. There is a globally agreed target to halt the rise in diabetes and obesity by 2025 [6,7]. Diabetes mellitus has increased all over the world in recent years. Because of its importance in this paper the profile of the diabetic patients are tried to be identified by using Cluster analysis. All of the related variables are examined in detail. Association rules show which symtoms occured together. In next studies preventive policies can be studied.
Acknowledgement
This work is supported by research fund of Istanbul University (BAP) with the project number of 23408.
References
- https://www.diabetesresearch.org/what-is-diabetes.
- Giudici P (2003) Applied Data Mining. Wiley pp:76-77.
- https://www.diabetesresearch.org/what-is-diabetes
- Mac Queen JB (1967) Some Methods for Classification and Analysis of Multivariate Observations. Proceedings of 5-th Berkeley Symposium on Mathematical Statistics and Probability.Statistics 1: 281-297
- Westhpal C, Blaxton T (1998) Data Mining Solutions: Methods and Tools for Solving Real-World Problems. Wiley pp: 186-189
- Tan PN, Steinbach M, Kumar V (2006) Introduction to Data Mining. Addison-Wesley pp: 328
- Han J, Kamber M (2006) Data Mining Concepts and Techniques. Morgan Kaufmann pp: 229-230
Open Access Journals
- Aquaculture & Veterinary Science
- Chemistry & Chemical Sciences
- Clinical Sciences
- Engineering
- General Science
- Genetics & Molecular Biology
- Health Care & Nursing
- Immunology & Microbiology
- Materials Science
- Mathematics & Physics
- Medical Sciences
- Neurology & Psychiatry
- Oncology & Cancer Science
- Pharmaceutical Sciences
